
Lebanon’s Municipalities and Their Revenues : 1000 Municipalities
Number of municipalities
The number of municipalities has been growing by the month until it reached 1000 by the end of April 2013. During the most recent municipal elections in May 2010, the number of municipalities stood at 964 compared to 904 in the 1998 elections. Establishment of municipalities boomed mostly in the Qada’a of Akkar and that of Baalbeck, while there was stability in the number of municipalities in the Aqdiyah of Baabda, Zgharta, Koura, Rashaya and Marjeyoun. Table 1 illustrates the distribution of municipalities by Mohafazah/Qada’a.
|
Distribution of Municipalities by Mohafazah and Qada’a |
Table 1 |
||
|
Mohafaza/Qada’a |
No. of municipalities in 1998 |
No. of municipalities end of April 2013 |
No. of towns and villages |
|
Mohafazah of Mount-Lebanon |
304 |
318 |
480 |
|
Chouf |
72 |
74 |
96 |
|
Aley |
55 |
57 |
72 |
|
Baabda |
45 |
45 |
63 |
|
Kessrouan |
48 |
52 |
70 |
|
Matn |
48 |
53 |
96 |
|
Jbeil |
36 |
37 |
83 |
|
Mohafazah of North-Lebanon |
212 |
261 |
385 |
|
Tripoli |
3 |
3 |
3 |
|
Batroun |
22 |
27 |
67 |
|
Bsharri |
11 |
12 |
21 |
|
Zgharta |
31 |
31 |
50 |
|
Akkar |
86 |
121 |
148 |
|
Mennieh-Dennieh |
25 |
33 |
51 |
|
Koura |
34 |
34 |
45 |
|
Mohafazah of Beqa’a |
139 |
159 |
236 |
|
Baalbeck |
53 |
66 |
103 |
|
Hermel |
4 |
7 |
32 |
|
Rashaya |
26 |
26 |
26 |
|
Zahle |
28 |
29 |
40 |
|
Western Beqa’a |
28 |
31 |
35 |
|
Mohafazah of South-Lebanon |
133 |
144 |
176 |
|
Saida |
42 |
47 |
53 |
|
Tyre |
56 |
61 |
68 |
|
Jezzine |
35 |
36 |
55 |
|
Mohafazah of Nabatieh |
115 |
117 |
131 |
|
Nabatieh |
38 |
39 |
41 |
|
Marjeyoun |
26 |
26 |
33 |
|
Hasbaya |
15 |
16 |
21 |
|
Bint Jbeil |
36 |
36 |
36 |
|
Mohafazah of Beirut |
1 |
1 |
1 |
|
Total |
904 |
1,000 |
1,409 |
Source: Compiled by Information International based on decisions issued by the Ministers of Interior and Municipalities.
According to the table above, there remain 409 towns lacking local governments in Lebanon. While all the towns in the Aqdiyah of Rashaya, Bint Jbeil and Tripoli and the overwhelming majority of those in the Aqdiyah of Western Beqa’a, Saida, Tyre, Nabatieh, Hasbaya and Marjeyoun are entitled to self-governing local entities, the presence of municipal councils is less evident in the Aqdiyah of Jbeil, Matn, Batroun, Zgharta, Akkar and Hermel.
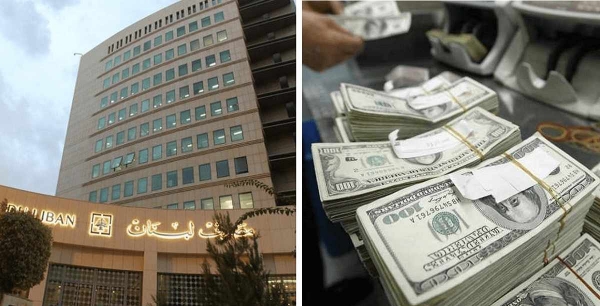
Revenues of the Independent Municipal Fund
The Lebanese government collects fees on imports and fuel and deposits them into the IMF for distribution to municipalities in line with specific criteria. The amount of the IMF transfers varies from one year to the next as illustrated in the following Table 2 and the funds are often delayed for years and disbursed in installments after deducting the amounts due to Sukleen and amounting to 40% of the revenues of municipalities benefitting from Sukleen’s waste collection services.
|
Evolution of the IMF transfers (1996-2010) |
Table 2 |
|
|
Year |
Transfers (LBP billion) |
|
|
1996 |
51 |
|
|
1997 |
190 |
|
|
1998-1999 |
400 |
|
|
2000 |
100 |
|
|
2001 |
200 |
|
|
2002 |
200 |
|
|
2003 |
250 |
|
|
2004 |
200 |
|
|
2005 |
220 |
|
|
2006 |
290 |
|
|
2007 |
280 |
|
|
2008 |
300 |
|
|
2009 |
400 |
|
|
2010 |
468 |
|
Source: Distributional decrees as published in the Official Gazette in the respective years (NB: the distributional decree for 2011 was issued on April 13, 2013)
Distribution criteria
Decree No. 1917 issued on April 6, 1979 and its amendments specified the criteria for distribution of the IMF funds. The 2012 IMF funds were divided as follows:
1. LBP 56.160 billion or 12% were allocated to municipal unions and were in turn assigned as follows:
- 60% based on registered population within the union
- 40% based on the number of municipalities within each union for development projects
2. LBP 411.8 billion or 88% were allocated to municipalities and were in turn assigned as follows:
- 5% or LBP 20.5 billion for the Civil Defense Independent Fund
- The remaining LBP 391.2 billion were further divided as follows:
- 90% based on registered population (78%) and the actual direct revenues collected by municipalities during the two years prior to distribution (22%)
- 10% were distributed equally to the municipalities having no more than 4000 registered people for the purpose of development projects.
Shares of municipalities
The share that each municipality receives from the IMF differs according to the rules mentioned previously. Tripoli ranks second to Beirut 1 among the municipalities privileged with the largest transfers. The following Table 3 illustrates the major allocations channeled to municipalities in 2010:
|
Distribution of major shares by municipality in 2010 |
Table 3 |
|
|
Municipality |
Share (LBP billion) |
|
|
Beirut |
67 |
|
|
Tripoli |
16.9 |
|
|
Zahle |
5.9 |
|
|
Saida |
5.5 |
|
|
Ghobeiry |
4.6 |
|
|
Jdaideh |
4 |
|
|
Mina |
3.9 |
|
|
Burj Hamoud |
3.7 |
|
|
Baalbeck |
3.1 |
|
|
Tyre |
2.9 |
|
|
Jounieh |
2.4 |
|
Source: Official Gazette No.3/2012
The shares by Qada’a are illustrated in Table 4, with the Qada’a of Matn having the largest amount (LBP 25 billion), followed by Tripoli (LBP 21.2 billion). The smallest shares were allocated to Hermel and Bsharri with LBP 3.1 billion and LBP 3.3 billion respectively.
|
Distribution of shares by Mohafazah/Qada’a |
Table 4 |
|
|
Aqdiyah |
Share (LBP billion) |
|
|
Matn |
25.018 |
|
|
Kessrouan |
12.245 |
|
|
Jbeil |
6.237 |
|
|
Baabda |
21.436 |
|
|
Aley |
11.7 |
|
|
Chouf |
16.1 |
|
|
Total shares of the Mohafazah of Mount Lebanon |
92.826 |
|
|
Tripoli |
21.270 |
|
|
Batroun |
4.671 |
|
|
Koura |
4.850 |
|
|
Mennieh-Dennieh |
84.753 |
|
|
Akkar |
21.570 |
|
|
Zgharta |
5.406 |
|
|
Bsharri |
3.301 |
|
|
Total shares of the Mohafazah of North Lebanon |
69.821 |
|
|
Zahle |
14.556 |
|
|
Baalbeck |
21.564 |
|
|
Hermel |
3.107 |
|
|
Western Beqa’a |
7.500 |
|
|
Rashaya |
3.760 |
|
|
Total shares of the Mohafazah of Beqa’a |
50.487 |
|
|
Saida |
14.847 |
|
|
Jezzine |
4.014 |
|
|
Tyre |
15.483 |
|
|
Total shares of the Mohafazah of South Lebanon |
34.704 |
|
|
Nabatieh |
12.184 |
|
|
Bint Jbeil |
12.052 |
|
|
Hasbaya |
3.663 |
|
|
Marjeyoun |
9.424 |
|
|
Total shares of the Mohafazah of Nabatieh |
37.323 |
|
Source: Official Gazette No.3/2012
Municipalities’ shares of telecom revenues
In January 2013, Telecommunications Minister Nicolas Sehnaoui announced that the Cabinet had agreed to distribute the municipalities’ shares of the telecom revenues (10% of mobile phone bills) after the government had been withholding them for 20 years. The revenues estimated at USD 1.2 billion are distributed as follows: 80% is channeled based on the registered population of each municipality and 20% based on the residing population.
This move will provide additional resources that municipalities should employ to initiate real development projects instead of wasting funds to create employment and pay uncalled-for salaries to serve political and electoral interests.
Despite the shares they receive from the IMF and the telecom and water revenues, and the fees they charge on building permits, most municipalities are still lacking adequate and efficient development plans, and their financial resources can hardly pay municipal employees. So was the expansion in the establishment of municipalities a squandering of funds or were the municipalities responsible for scattering the dreams of development?


Leave A Comment