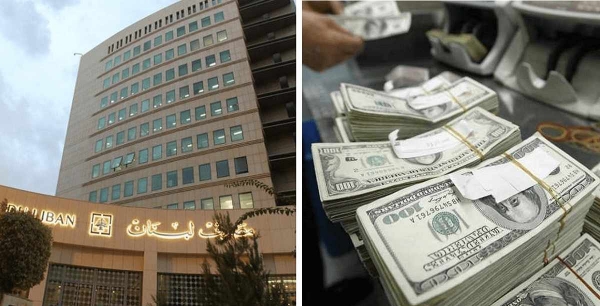
Lebanon’s Cost of Food Rises by 6% in 2012
|
Cost of food in 2012 compared to 2011 |
|||
|
Items |
2011 cost (LBP) |
2012 cost (LBP) |
% of change (LBP) |
|
Vegetable oil |
32,000 |
34,900 |
+2,900 |
|
Olive oil |
13,500 |
12,900 |
-600 |
|
Ketchup |
3,200 |
4,500 |
+1,300 |
|
Mayonnaise |
4,100 |
3,500 |
-600 |
|
Tahina |
6,850 |
7,450 |
+600 |
|
Tomato sauce |
3,250 |
3,300 |
+50 |
|
Milk |
10,000 |
10,400 |
+400 |
|
Yogurt |
10,000 |
12,000 |
+2,000 |
|
Labneh |
17,000 |
20,000 |
+3,000 |
|
Butter |
5,000 |
5,200 |
+200 |
|
Lentils |
3,750 |
3,750 |
- |
|
Rice |
3,200 |
3,500 |
+300 |
|
Chickpeas |
3,750 |
4,100 |
+350 |
|
Beans |
1,750 |
2,000 |
+250 |
|
Pasta |
4,400 |
4,450 |
+50 |
|
Sugar |
9,500 |
7,500 |
-2,000 |
|
Salt |
1,800 |
1,500 |
-300 |
|
Meat |
34,000 |
26,000 |
-8,000 |
|
Eggs |
15,800 |
16,000 |
+200 |
|
Coffee bean |
16,000 |
17,200 |
+1,200 |
|
Jams |
12,000 |
12,000 |
- |
|
Vegetables |
33,000 |
43,000 |
+10,000 |
|
Fruit |
25,000 |
30,000 |
+5,000 |
|
Total |
268,850 |
285,150 |
+16,300 |
Source: Information International


Leave A Comment