
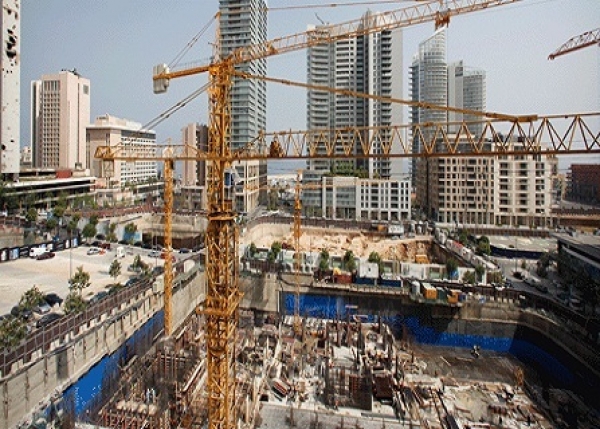
Construction Permits Decline by 25%
In order to determine the size of contraction in the construction sector, it may be useful to rely on accurate statistics such as the construction permits issued by the Orders of Engineers in Beirut and the north. Although the construction permits do not necessarily mean execution of works, they are still considered an essential indicator of the fluctuating trends in the construction sector.
Construction Permits by Years and Months
The areas licensed for construction declined in 2012 by 10.4% as compared to those licensed in 2011. During the first seven months of 2013, the areas with legal construction permits registered a decline of 14% and 25% compared to the same period in 2012 and 2011 respectively.
Contrasted with other months, December has proven to be the month where the largest number of construction permits is granted, followed by June.
Table 1 illustrates the licensed construction areas by month between 2009 and 2013.
|
Licensed construction areas between 2009 and 2013 (areas in m2) |
Table 1 |
||||
|
Month/ Year |
2009 |
2010 |
2011 |
2012 |
2013 |
|
January |
260 |
645 |
925 |
944 |
748 |
|
February |
1,041 |
1,126 |
1,182 |
1,260 |
1,085 |
|
March |
966 |
2,002 |
1,615 |
1,388 |
992 |
|
April |
972 |
1,315 |
1,555 |
1,142 |
1,320 |
|
May |
1,006 |
1,679 |
1,770 |
1,455 |
1,108 |
|
June |
2,025 |
1,622 |
1,793 |
1,374 |
1,023 |
|
July |
556 |
1,728 |
1,194 |
1,251 |
1,270 |
|
August |
866 |
1,610 |
1,141 |
924 |
- |
|
September |
1,410 |
1,388 |
1,215 |
1,099 |
- |
|
October |
1,096 |
1,345 |
1,257 |
1,134 |
- |
|
November |
1,209 |
1,189 |
1,034 |
1,095 |
- |
|
December |
2,929 |
1,931 |
1,705 |
1,612 |
- |
|
Total |
14,334 |
17,580 |
16,386 |
14,678 |
7,546 |
Source: Orders of Engineers in Beirut and the north
Construction Permits by Mohafaza
Mount Lebanon projects accounted for the majority of newly issued construction permits- approximately half of them- followed by the north Mohafaza with 20% of the total construction permits.
Table 2 illustrates the licensed construction areas by Mohafaza in 2011 and 2012.
|
Licensed construction areas by Mohafaza in 2011 and 2012 |
Table 2 |
|||
|
Mohafaza |
Licensed area in 2011 (m2) |
Percentage of the total licensed area (%) |
Licensed area in 2011 (m2) |
Percentage of the total licensed area (%) |
|
Mount Lebanon |
8,459,814 |
51.6 |
7,296,462 |
49.7 |
|
North |
2,738,256 |
16.7 |
2,471,632 |
16.8 |
|
South |
1,636,121 |
10 |
1,558,677 |
10.6 |
|
Beirut |
1,285,049 |
7.8 |
1,095,761 |
7.5 |
|
Beqa’a |
1,201,640 |
7.4 |
1,330,048 |
9 |
|
Nabatieh |
1,065,370 |
6.5 |
926,045 |
6.4 |
|
Total |
16,386,250 |
100 |
14,678,625 |
100 |
Source: Orders of Engineers in Beirut and the north
The decline in the licensed construction areas between 2011 and 2012 broke down as follows:
- Beqa’a was the only Mohafaza that registered an increase in construction permits: +10.7%
- Beirut: - 14.7%
- Mount Lebanon: -13.7%
- Nabatieh: -13.5%
- North: -9.7%
- South: -4.7%


Leave A Comment